Grid Planning Tool

Grid Planning Tool

Duration

Jun 2024 - Now

Company

X, the moonshot factory (formerly Google X)

Role

UX designer

Some details in these case studies have been simplified due to confidentiality — feel free to reach out for a more in-depth walkthrough or the full portfolio deck.

‍

Background

The electric grid was built more than a century ago as a one-way system — electricity flowing from fossil-fueled power plants to homes and cities. Today it looks more like a multidirectional superhighway, with millions of devices, from solar panels to EVs, pushing and pulling energy across it at once. Yet no one has a complete, real-time picture of how the grid actually works — that information is siloed across dozens of organizations.

‍

‍

Tapestry is X's moonshot for the electric grid. Our mission is to make the grid visible to everyone who plans, builds, and operates it — so it can become greener, fairer, and more reliable for everyone who depends on it.

‍

‍

‍

I worked closely with engineers, product managers, and grid planners across two products under Tapestry — grounding every design decision in user research and usage data to make a highly technical domain approachable.

‍

‍

Problem

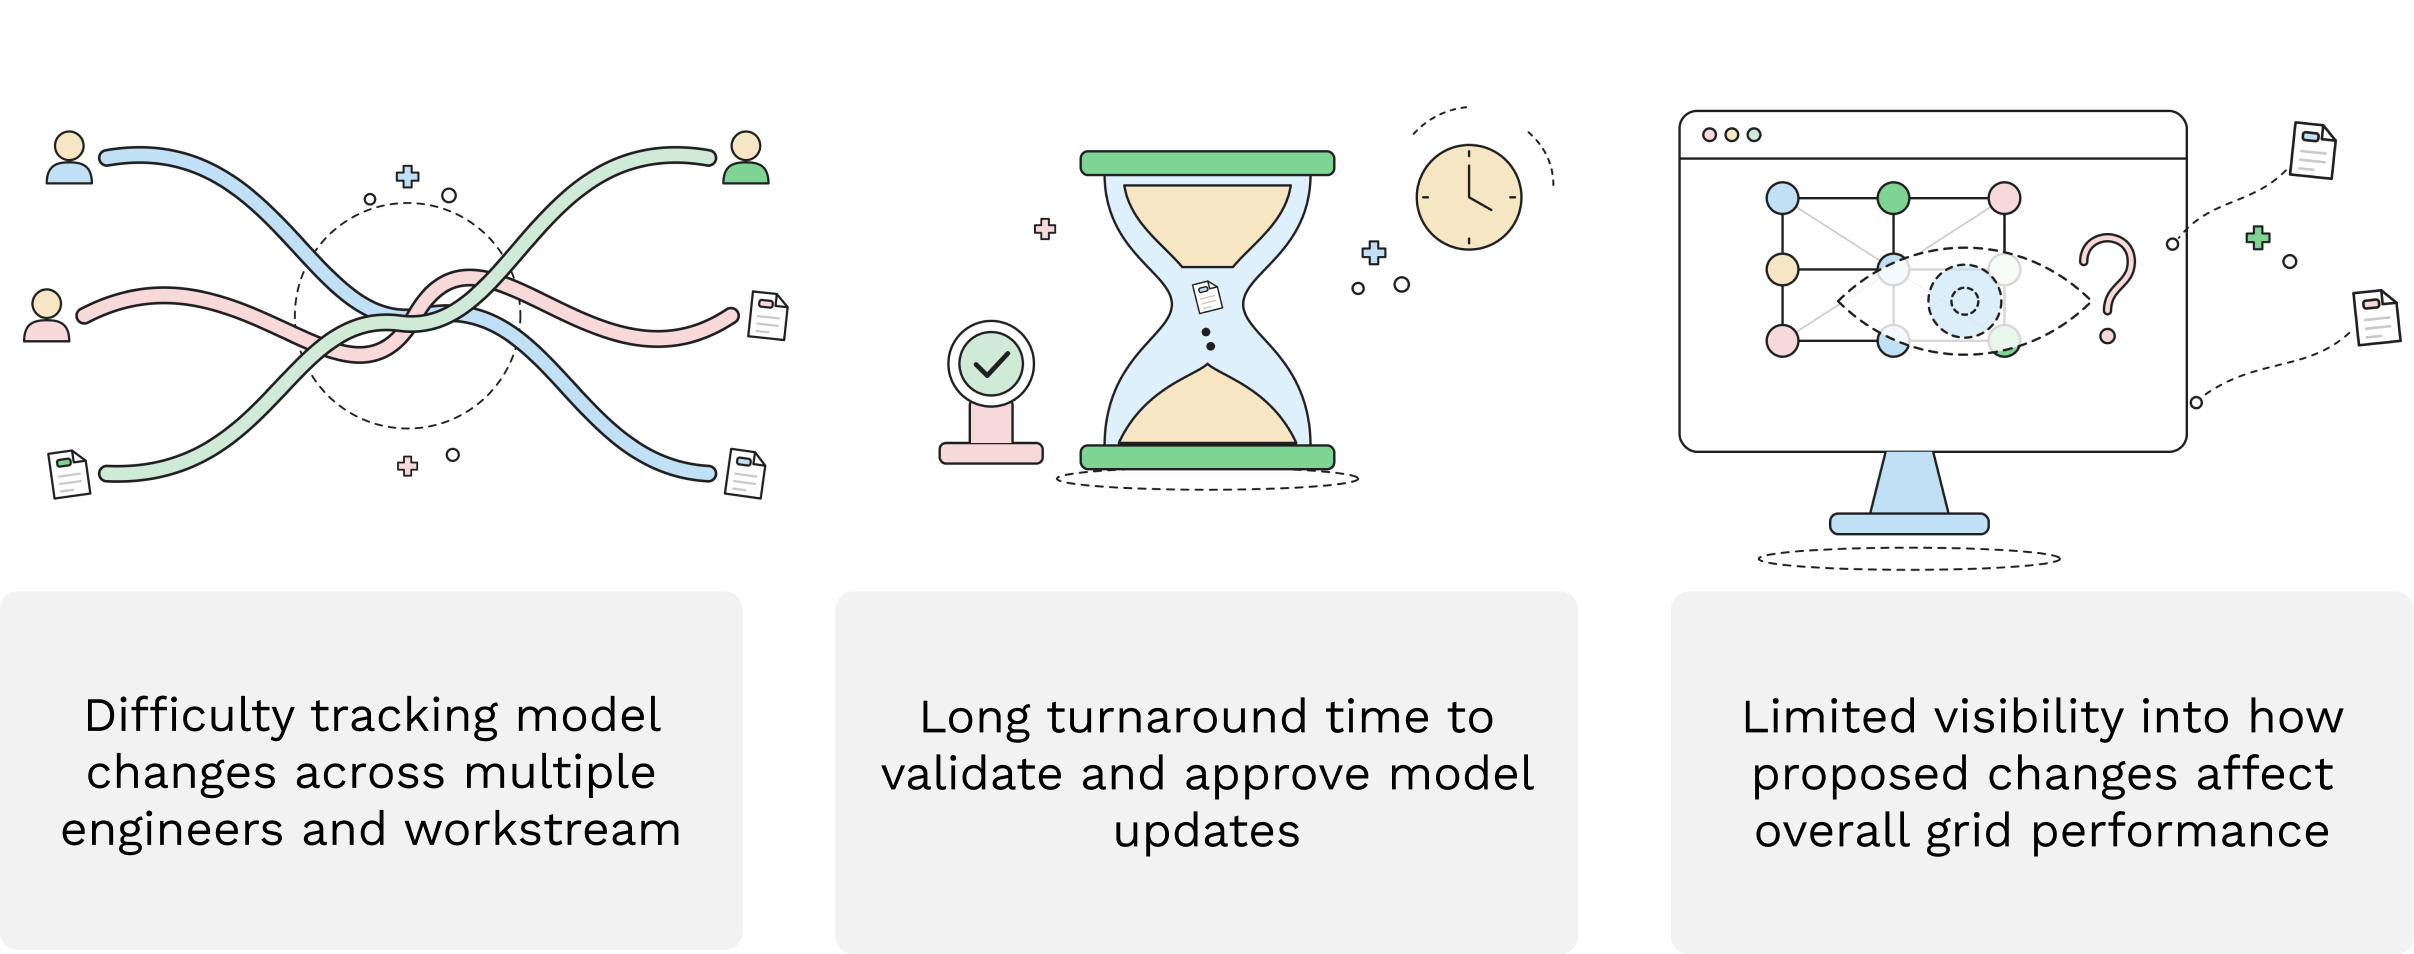
Grid planners design, evaluate, and maintain the regional power grid, using simulations to see how the network behaves under different scenarios, years or decades ahead. I designed the core project and asset management flow, and the data visualizations that help planners compare results.

‍

Solution

What I did

Reorganized the information architecture around assets, not changes. Before, the same asset appeared again and again under each change, making history hard to follow. Organizing by asset gives each one a full lifecycle, so planners can see what’s new, edited, or decommissioned at a glance.
Brought visibility into navigation and panels. Tags for new, edited, and decommissioned assets sit directly in the navigation, and the project panel shows a clear hierarchy of what changed. Selecting a project highlights its assets on the map.
Moved validation earlier. A “check validity” step catches errors while a project is being built, instead of after a simulation fails.
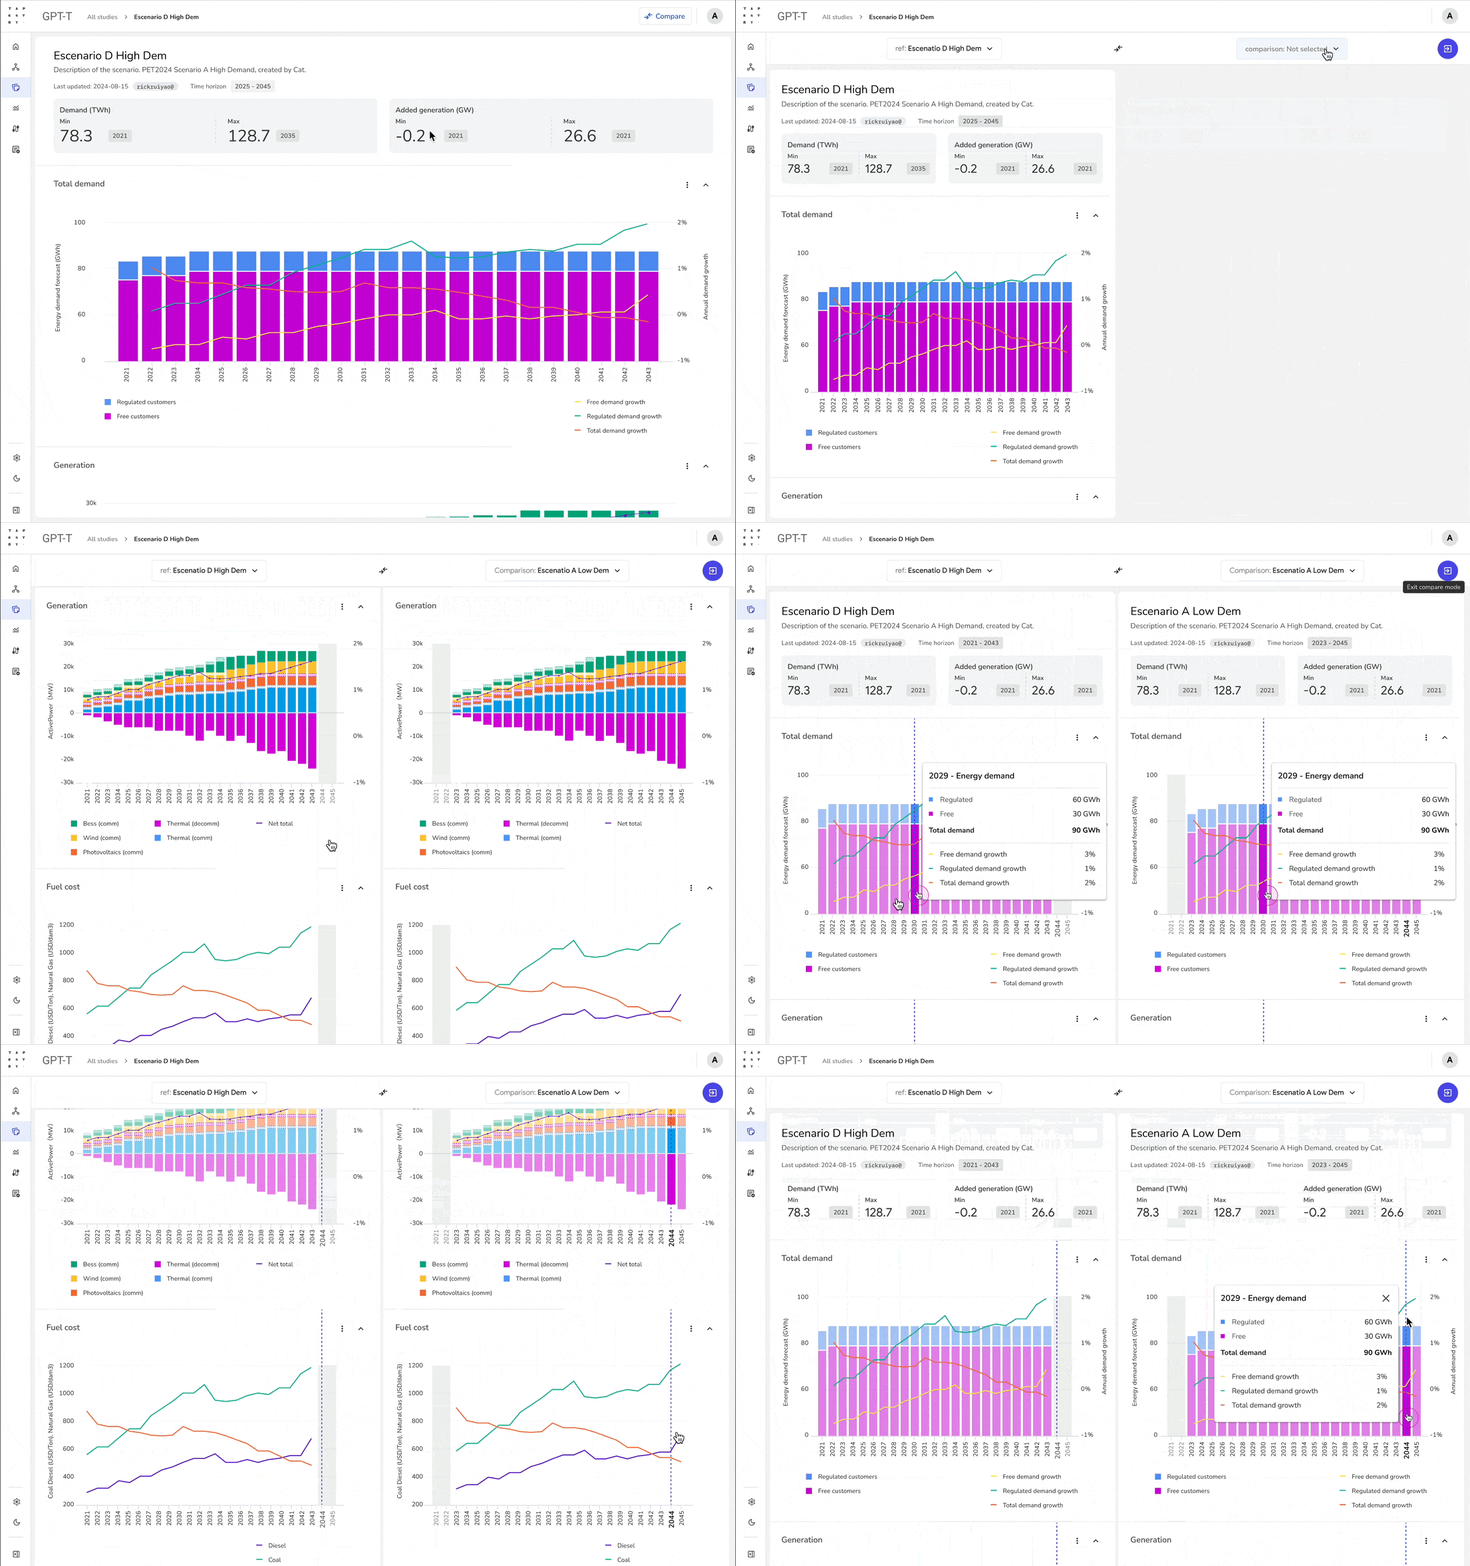
Designed data visualization and comparison for simulation results across scenarios.
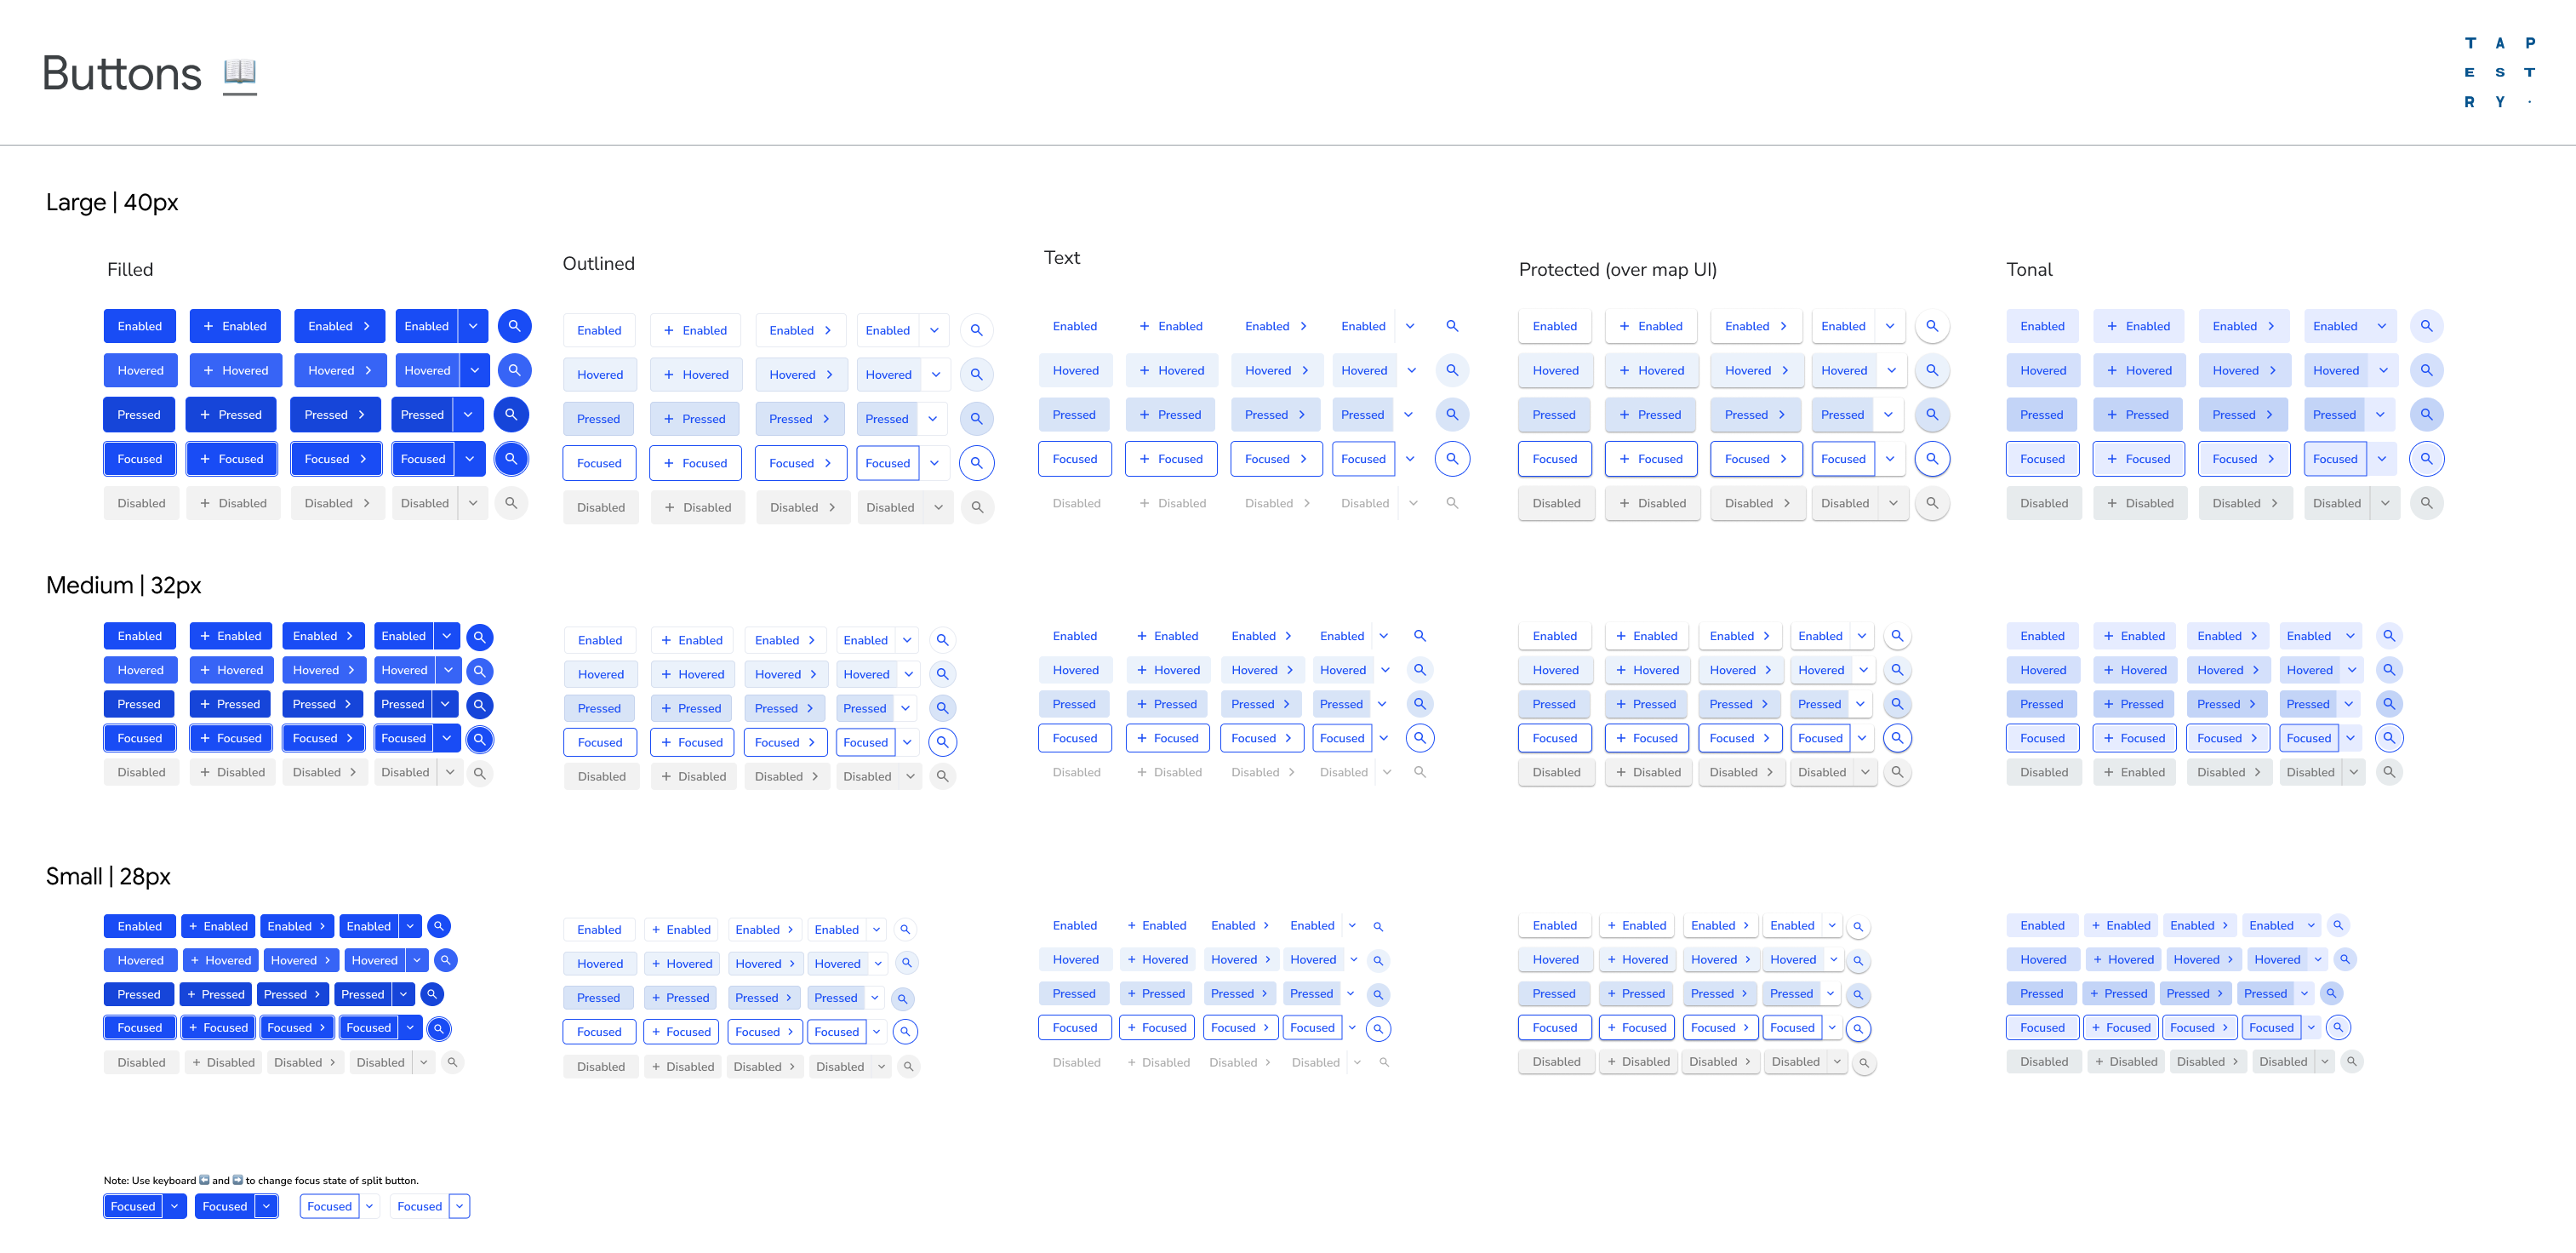
Built the design system (color, components, patterns) so Tapestry’s products share one language.

‍

Add project & add asset

‍

‍

‍

Simulation result overview

‍

‍

‍

Data visualization and comparison
‍
‍
‍

‍

Color usage guideline

‍

One of the key components I created

‍

‍

Impact

Simulation run success rate up 31.8% (now 97.1%), because errors are caught earlier

‍

User engagement up 38.2%

‍

The major client confirmed using the tool for its annual transmission expansion planning

‍

A new client was onboarded to the model management platform

‍

‍

‍

Takeaways

Structure matters a lot in dense tools. The biggest gains didn’t come from adding functionality, but from changing how information is organized. Matching the structure to how planners think reduced cognitive load as studies grew.

‍

Catch problems where they start. Moving validation to the moment of creation prevented errors instead of reporting them later, and it’s what lifted the success rate.

‍

Systems make teams faster. A shared design language kept two very different products consistent and made each new feature quicker to build and easier to trust.

‍

Other PROJECT